
Rarely have I blown away by something, but in this case I was. I remember it like it was yesterday when we talked about Shear-Moment diagrams in our Strength of Materials Class. Wow, what a cool and handy concept! Nearly 20 years later, I’m still using this wonderful tool.
A shear-moment diagram is an engineering tool where the shear force is calculated at each point along the length of he beam. A moment diagram is drawn below the shear diagram to the same scale. The moment can be calculated at any point by integrating the shear diagram.
The concept of integrating the shear force to find the moment is fascinatingly simple and fairly simple to do. It only leaves me with the question, “Why don’t I see this more?”
To create a Shear-Moment Diagram you need to assess the support conditions and calculate the reactions from a beam table. Then plot the internal shear force in the beam as it changes along its length. This curve can then be integrated to determine the moment at any point.
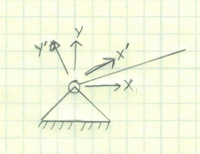
Sign Convention
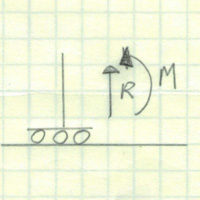
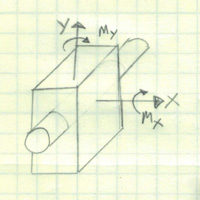
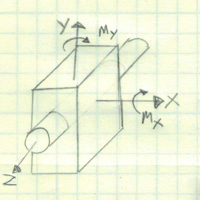
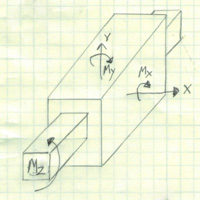
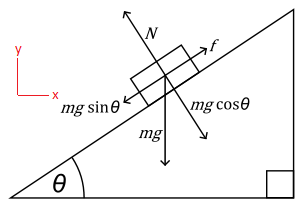
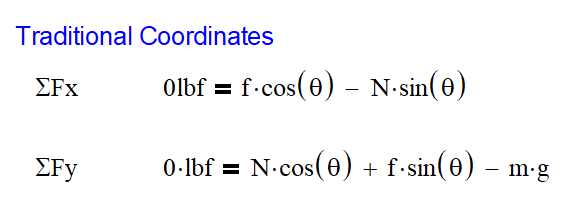
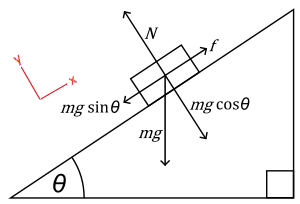
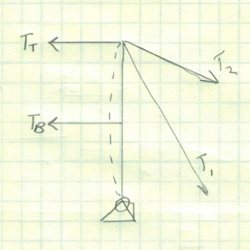
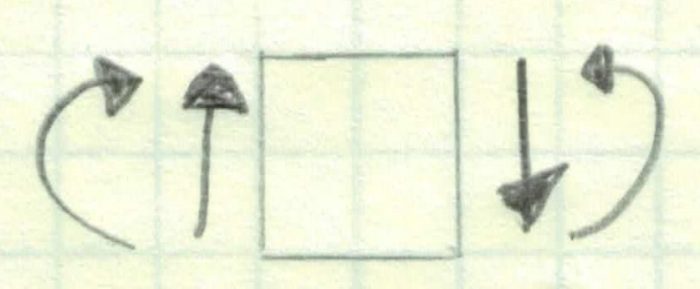
Before we get down to the nuts and bolts of the diagrams, we need to make every effort to set us up for success. This is done by creating a sign convention. It doesn’t really matter which direction your signs are, what really matters is that you are consistent with it. I choose to use the standard convention, shown below, which has the compressive moment as positive. Often this is reversed when dealing with concrete structures in order to see where rebar should be used.
I’ll be honest, I’m torn on which convention to use. I have used the standard convention my entire career, but I see why the alternative has its benefits as well.
On the one hand, the standard convention allows you to integrate the shear diagram easily to determine the moment. This is great, but it leaves you with thought that the deflection of your beam is upward when it is not.
On the other hand, the alternative convention will show the moments below the line, as it would naturally deflect. The major downside is that when integrating, you will need to invert when integrating the moment. This additional step could result in adding moment when you should have subtracted and thus getting the wrong answer.
Shear Diagram
Let’s get started on creating the shear diagram.
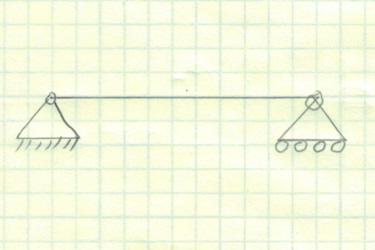
The first step in creating a shear diagram is assessing the problem. In this example, we have a simply supported beam where vertical forces are supported at the ends, but moment cannot be supported. This means that our moment diagram must be equal to 0 at each end. This will provide a built in check; more on that later.
We will then need to decide which way we will run our coordinate system for calculating the shear and moment. With a simply supported beam, it really doesn’t matter which way we go. Common practice is to work from left to right and I have shown that in my diagram with the x dimension pointing right. It is perfectly permissible to work from right to left as well.
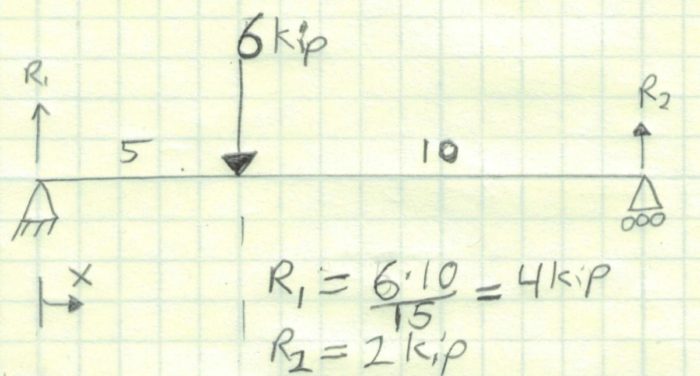
Third, we will calculate the reactions. For a case as simple as this I did a sum of the moments at R2 to find R1. I then summed the vertical forces to find R2.
Next we will begin to draw the shear diagram directly below the problem. I have dropped a vertical line at the point load so they line up. Working from left to right, I have placed the vertical shear load R1 from 0 in to 5 in. Since there are no other forces acting in this span, it is a horizontal line.
A 5 inches, the 6 kip point is applied in the opposite direction of R1. This will lower the 4 kip value of R1 by 6 kip resulting in -2 kip. This is shown as a vertical line with length of 6 kip. This line will remain at -2 kip for the rest of the beam length. At reaction R2, the shear force is increased to 0 kip. The reaction at each end of a simply supported beam must equal 0. If it doesn’t, an error has been made. (Note: this check does not exist for all beam types.)
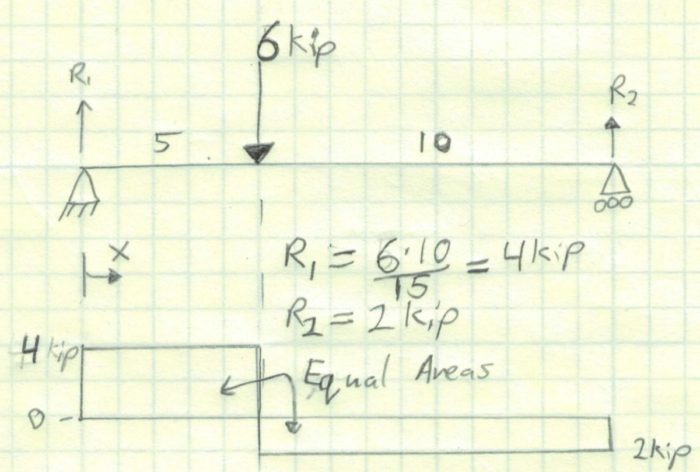
Right now, we could do a quick check to see if our moments will equal 0 at each end by making sure that the area above and below the curve is equal. Here we end up with an rectangle with area of 20 kip-in (4 kip x 5 in) and a rectangle of -20 kip-in (-2 kip x 10 in). When added together we get 0. Perfect.
What is the Shear Force?
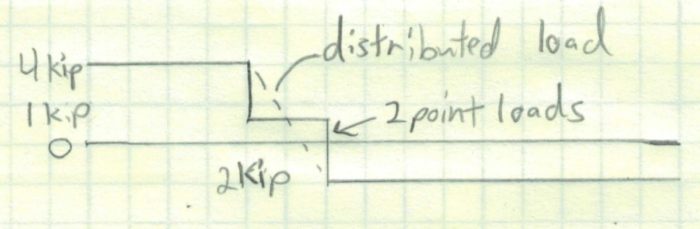
Early in my career, I was confused about what my shear load was from a point load. In the example above, what shear load do I use in my calculation, is it the 6 kip load or the 4 kip? Decisions, decisions.
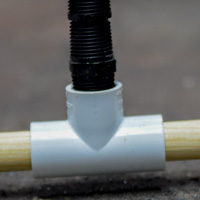
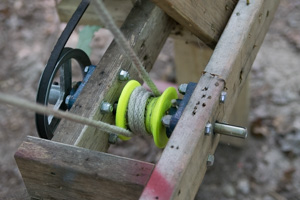
Well the answer is the 4 kip load. Think about it, when the load is applied it can’t actually be applied at a single point. If we zoom into the load enough (figure below), we will find out that the load is either distributed over a short length or applied at 2 (or more) smaller point loads. In either case, neither situation gives us the 6 kip load.
Moment Diagram
I know what you are thinking: the Integral – I hate calculus, and rightfully so. It is evil.
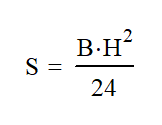
Just remember, the integral is only area under the curve and easily calculable for these diagrams. In most cases, we will be determining the area of a rectangle or triangle. Hopefully, you can remember those from grade school math. I have a table near the end of this article to help as well.
The other thing to keep in mind is the shape of the lines you are drawing. When integrating a rectangle, you will get a triangle. A triangle will give you a parabola. This isn’t a big deal.
So let’s get going. As I just mentioned, we have a rectangular shape in the shear diagram so the integral will be a triangle. If we look at the following table, we can see that the value increases linearly as we go from 0 in to 5 in. This is a triangle.
| Base (in) | Height (kip) | Area/Moment (kip-in) |
| 0 | 4 | 0 |
| 1 | 4 | 4 |
| 2 | 4 | 8 |
| 3 | 4 | 12 |
| 4 | 4 | 16 |
| 5 | 4 | 20 |
At 5 inches, we have a jump in the shear force, but not a jump in the moment. In fact, the moment must stay continuous unless there is an applied moment that exists at only one point. Also, note that while the value of the moment needs to stay the same, the slope does not. This is a great example of that.
Once we exceed 5″ in our x dimension, we need to start subtracting area (moment) from our diagram. The best way to do this is to reset the x dimension to 0. In this case, we would subtract 5 from all the total x values. This is show in column 2 in the table below.
| Base (in) | New Base (in) | Height (kip) | Moment (kip-in) | Total Moment (kip-in) |
| 5- | 0 | 4 | 0 | 20 |
| 5+ | 0 | -2 | 0 | 20 |
| 7 | 2 | -2 | -4 | 16 |
| 9 | 4 | -2 | -8 | 12 |
| 11 | 6 | -2 | -12 | 8 |
| 13 | 8 | -2 | -16 | 4 |
| 15 | 10 | -2 | -20 | 0 |
We can then calculate the moment from the area under the curve (it is a negative area) and display that in column 4. Finally, we calculate the total moment (column 5) by subtracting the maximum moment from the calculated moment at each point.
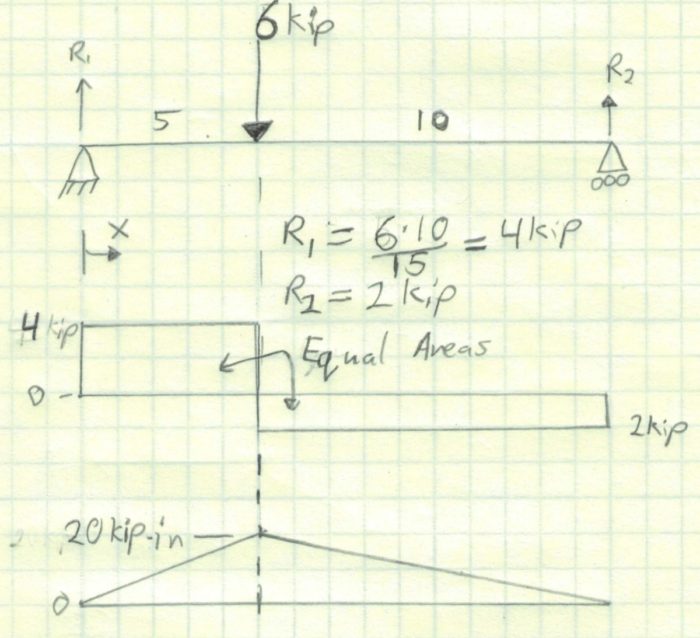
When we plot the results, we get the moment diagram shown below, which is an increasing triangle to 5″ and maximum moment of 20 kip-in. It is then followed by a decreasing triangle.
It is very important to note that the moment value reaches 0 in-lb at 15″. If it did not, we made a mistake at some point.
It is also important to point out that the tables above are unnecessary. I did them as a way to demonstrate that a triangle is the integral of a rectangle. In most cases you can calculate the end points of each step. In this case, I would simply plot the following 3 points understanding that the overall shape would be a triangle.
| x | Area/Moment (kip-in) |
| 0 | 0 |
| 5 | 20 |
| 15 | 0 |
It is important to know that I get the 20 kip-in by multiplying the 4 kip x 5″. I then get back to 0 kip-in by taking the maximum moment and adding -2 kip x 10″. I do not assume that the moment gets back to 0 because of the simply supported beam. This step provides a valuable check.
You now have the tools to begin to make many shear-moment diagrams
Other Examples
I understand that this is a fairly complicated process, so let’s look at some other examples before you’re thrown to the wolves.
Example 2 – Distributed Load on a Partial Span
Building on what we’ve learned, let’s have a distributed load on only a section of the span. It is a simply supported beam so we know there will not be any moments on the ends of the beam.
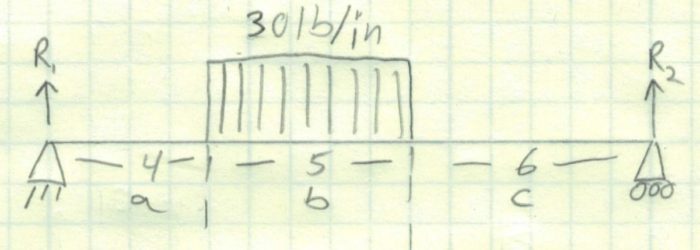
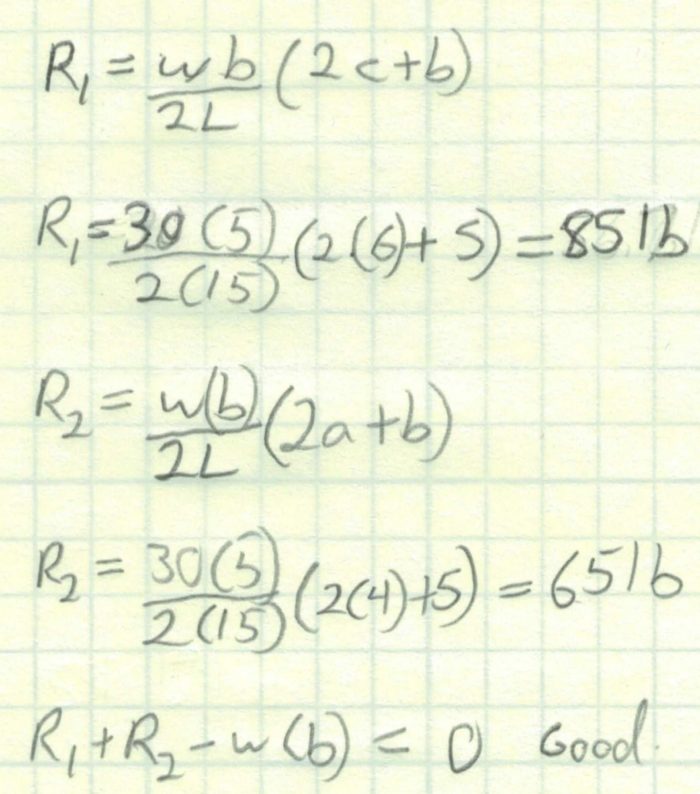
The first thing we need to do is calculate the reactions to find R1 and R2. Since this is a more complicated beam loading, we will use a beam table to find the reaction formulas.
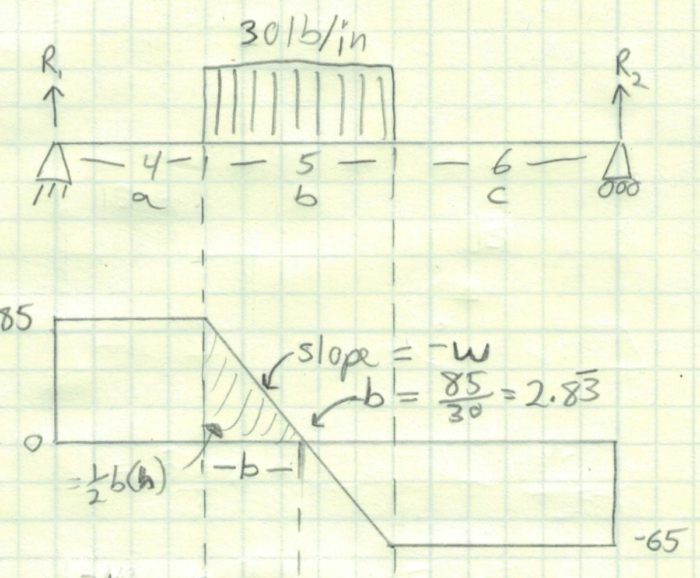
We find that R1 = 85 lb and R2 = 65 lb. The final step is to make sure that the forces cancel out using a check in the last line of the calculations. R1+R 2 -30 lb/in *5 in = 0 lb. Great!
Now we will draw the shear diagram. From 0″ to 4″ our shear value is R1. Between 4″ and 9″, the curve will be a straight line from 85 lb at 4″ to 85 lb-30lb/in * 5″ or -65 lb at 9″ From 9″ to 15″ the curve will be a horizontal line at -65 lb.
A couple things to note here. First of all the slope of the line will be value of the distributed load. Since it is a downward load, it will have a negative slope.
Second, we will want to find the value of where the line crosses 0. This will become important in the moment diagram because this will be the location of the maximum moment. In other words, all the area before this point is positive and all area after it is negative. It will also make the triangles easy to calculate.
We can calculate the dimension “b” by dividing initial height of the line by the slope of the line. The answer is b= 85 lb / 30 lb/in or 2.83 in.
Next, let’s plot the moment diagram. The section from 0″ to 4″ is easy because it is a rectangle. At 4″, the moment value is 85 lb x 4″ or 320 in-lb. We can draw a line between the two points and it makes a triangle.
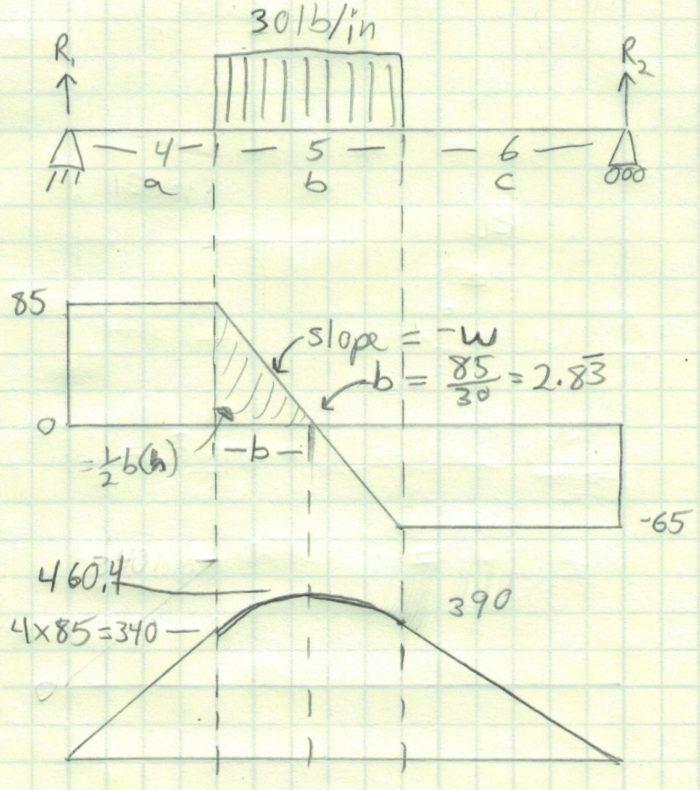
The next value is a little bit trickier. We will need to determine the area of the triangle where the intercept is 0. We already calculated that b = 2.83″ Here we use the area of a triangle is (b*h)/2 or (2.83*85)/2 or 120.4 in-lb. Because the moment must be continuous, we need to add this value to the previous value (340 in-lb + 120.4 in-lb). This gives us the maximum beam moment of 460.4 in-lb.
We can plot this point, but don’t draw the line connecting them quite yet. I want to show you something cool in a minute.
We will now complete the last point of the distributed load at x = 9. At this point we will want to add in the negative triangular area which is ((5-b) * -65) / 2. This area is 70.4 in-lb and we will need to subtract that from the previous moment to get 390 in-lb.
At this point, I want to connect the dots for the distributed load segment. The integral of a triangle is a parabola. We also know that it is a continuous curve between x = 4 and x = 9 and the slope of the line will need be 0 at b.
As we finish the moment diagram, the rectangular section at the right end has an area of -65 lb x 6 in or 390 in-lb. That is equal to the moment at x=9. This indicated that the moment at the right support is equal to 0.
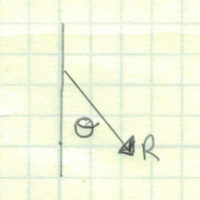
Example 3 – Moment Applied at a Single Point
I’ve mentioned that the moment diagram will need to be continuous except for the case where a moment is applied at a single point. Let’s explore that concept in our next example.
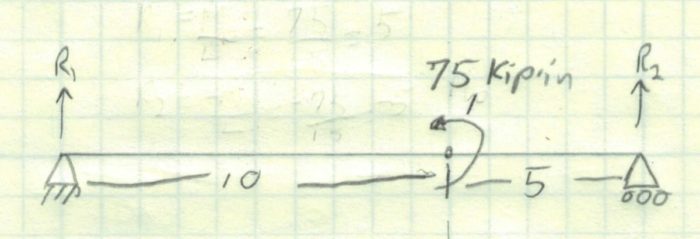
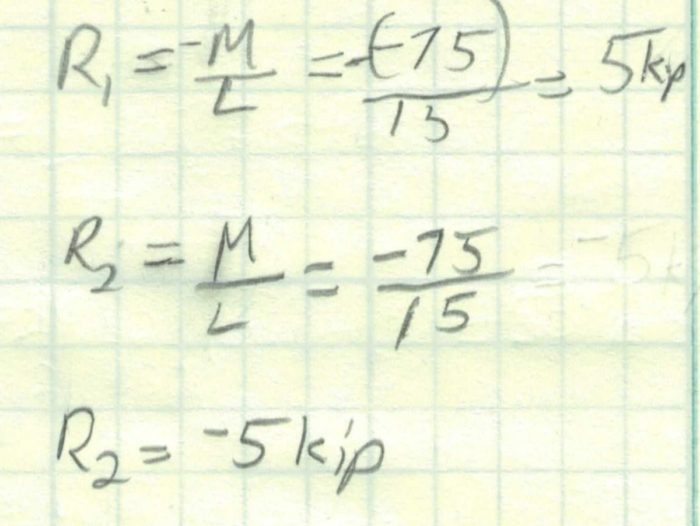
Once again we have a simply supported beam so there will be no moment at the ends. Looking up our end reactions in the beam tables, we find the following. Note, that our moment applied is in the opposite direction of the sign convention. We end up with 5 kip for R1 and -5 kip for R2.
Now we can draw the shear diagram. This is the simplest shear diagram possible because there are no other loads to change the shear force along the length of the beam.
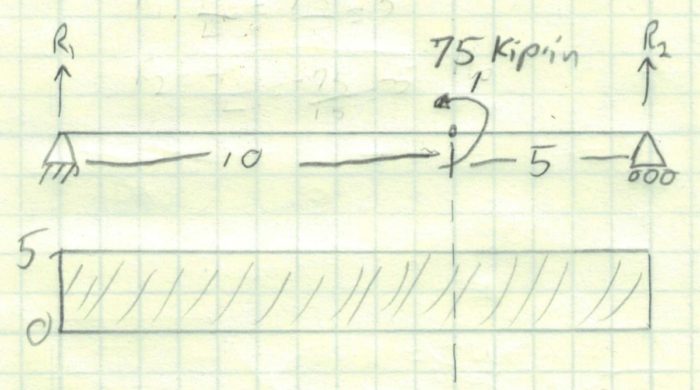
If we follow the same procedure as we did with the other diagrams, we won’t get the right answer. Looking at the rectangular area, it is easy to say that our maximum moment is 15″ x 5 kip or 75 kip-in. That is wrong because that moment would exist at the right support where we know there can be no moment.
Instead, we need to take the area above the curve to where the moment is applied. (10″ x 5 kip = 50 kip-in). At this point, we will subtract the applied 75 kip-in from the moment. Here is where our discontinuity in the moment comes from.
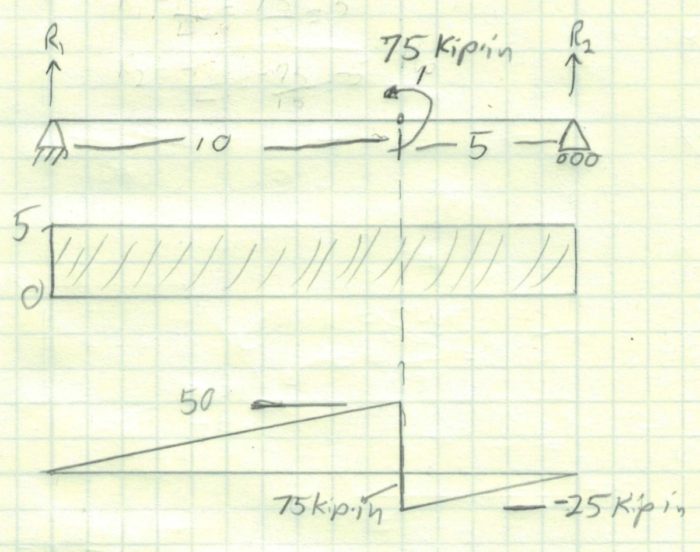
Finally, we will integrate the remaining area in the shear diagram and trust that we will get back to 0 at the right reaction. The area is 5″ x 5 kip or 25 kip-in which will negate the moment at the reaction point.
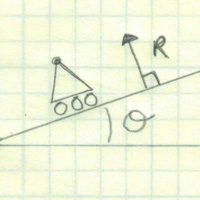
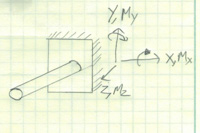
Example 4 – Cantilevered Beam with Declining Distributed Load
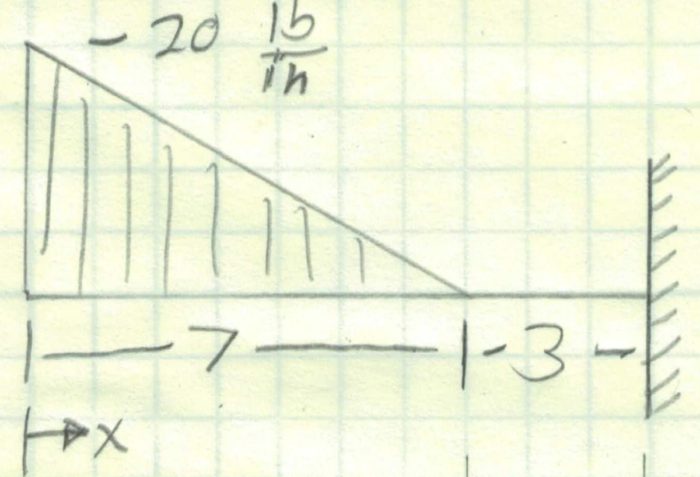
In this case, we have a cantilevered beam where moment and shear can build up at the end. In the other examples we have moved from left to right in our beam analysis. We will be doing that again here, but if the beam was drawn the opposite way, we would want to work from right to left. You will always want to start from the free end of the beam and work towards the supports.
Perhaps, you could look up this loading in a beam table and figure out the reactions but there are two problems with that method. First, I couldn’t find this load case in any table. I found a decreasing load over the entire length of the beam which would be a more conservative case. Second, it is just a whole lot of extra math. Just start at the free end.
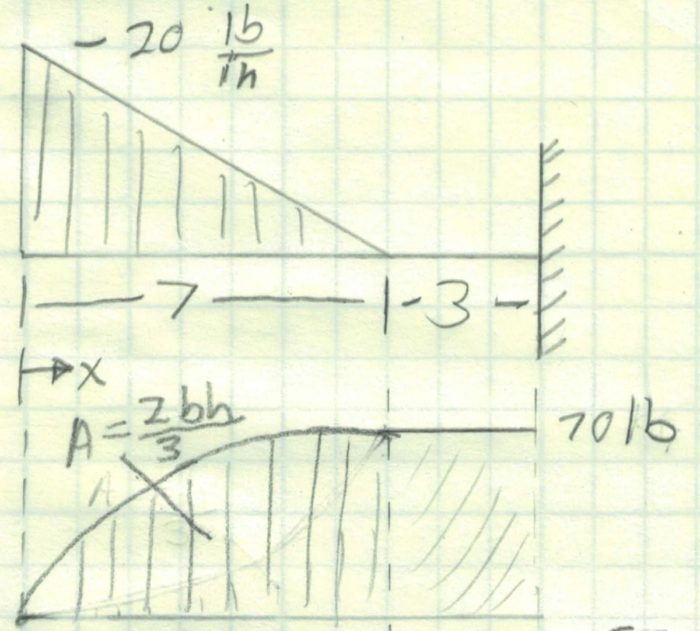
When drawing the shear diagram, we are going to get a steeply rising parabola that flattens out to horizontal at x =7. Between 7 and 10, there will be a horizontal line because no other shear forces are applied.
On thing that I learned in my research here is that there is a cool formula for calculating the area under any parabola. The following table shows the relation between shape and area.
| n | Shape | Area Under Curve | Area Above the Curve |
|---|---|---|---|
| (b * h) / (n + 1) | (b * h) * n / (n + 1) | ||
| 0 | 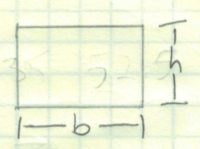 | b * h | 0 |
| 1 | 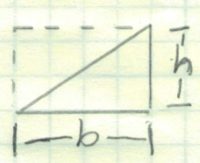 | b * h / 2 | b * h / 2 |
| 2 | 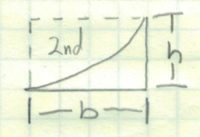 | b * h / 3 | b * h * 2 / 3 |
| 3 | 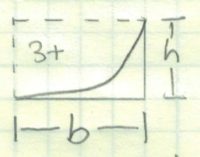 | (b * h) / (n + 1) | (b * h) * n / (n + 1) |
We can now start constructing the moment diagram. First, we can use the n=2 value in the table above to find the area above the curve with the equation 2/3 (b*h). This evaluates to 326.7 in-lb. We then add the moment of the 3″ extension to get a total moment of 536.7 in-lb.
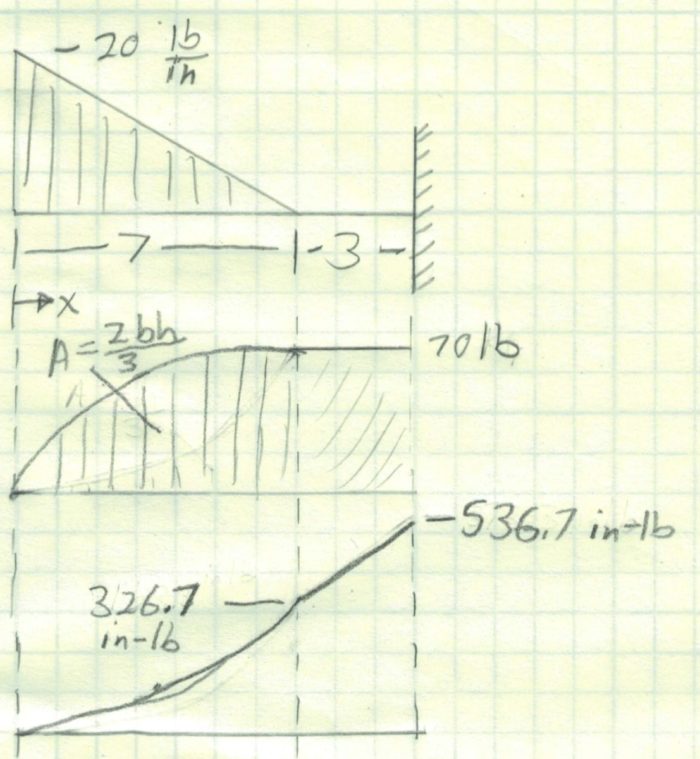
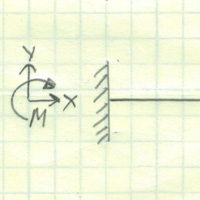
Once we have spanned the length of the beam, we can determine what the reaction is at the cantilevered support. They are a vertical force of 70 lb and a moment of 536.7 in-lb. There is no horizontal reaction force because there are no horizontal loads.
Conclusions
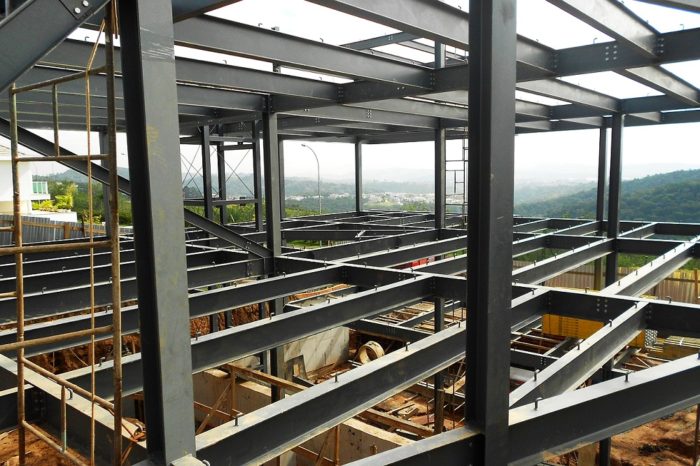
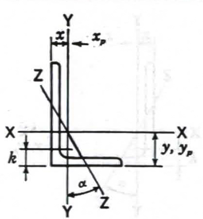
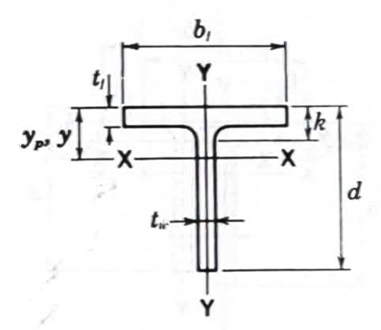
Shear-Moment Diagrams are powerful tools for the engineer. It allows one to visualize what is happening in any beam with just about any loading and reactions. The more you use this tool, the better you will become at quickly assessing the loads on beams and how to properly design them. This is especially important if you are trying to minimize weight and want to use tapered sections. In this case you can put more material where the moment is high and thin down the section elsewhere.
If you are having difficulty using this concept, please keep with it. At some point this will become second nature. Using the table above will greatly reduce the trouble of integrating.